FinanceFlow
The design and development of a full-stack FinTech application powered by a predictive AI engine.
What
SaaS | Web Application
Why
Market + Personal need
Where
São Paulo, Brazil
Role
AI Product Designer
Category
Finance, FinTech, GenAI
When
June 2025 - Ongoing
You're currently viewing the executive summary case study. Looking for a detailed design process? View it here.
Context
My journey with personal finance tracking started out of necessity. Back in 2006, when I moved to São Carlos for college, my father asked me to send him a monthly spreadsheet detailing all my expenses so he could manage my allowance. This simple habit stuck with me. For nearly two decades, I meticulously filled out spreadsheets, month after month, year after year.
This long-standing personal "itch" was the spark for FinanceFlow — an AI-powered personal finance web app. I took on the role of AI Product Designer, running the project end-to-end: research, design, and development.

The Problem
My personal experience with spreadsheets was a strong starting point, but it needed validation. My initial quantitative research (N=150) confirmed the hypothesis immediately: financial fragmentation is the norm, not the exception.
69% of users manage two or more financial platforms.
39% still rely on manual spreadsheets — current digital solutions are failing them.
This fragmentation creates real, recurring pain:
63% struggle with spending more than planned.
59% feel a lack of vision about "where their money went."
54% admitted to forgetting to pay bills or invoices.
Top Financial Challenges
Survey of 150 users, multiple selection
Operating more than one platform
69%
Spending more than planned
63%
No visibility into where money goes
59%
Forgetting to pay bills or invoices
54%
"I feel like I'm flying blind with my money. I know it's coming in and going out, but I don't know where or why."
— from in-depth user interviews
The Research Approach
To avoid designing around a single point of view, the research combined three complementary methods — each answering a different question a business needs answered before it commits budget to a new product direction.
06
In-Depth Interviews
6 participants across 2 user segments (3 per segment). Semi-structured script — context, pain points, routines, expectations
N=150
Online Survey
150 respondents, structured questionnaire. Segmented by profile, pain points, and needs
03
Desk Research main sources
Secondary market data — Open Finance, AI trust, LGPD. Used to cross-validate field findings against broader market patterns
Process note: the desk research ran as cross-validation after the fieldwork. The recommended sequence for future cycles is the reverse — desk research first, to sharpen the interview and survey instruments before fielding them.
The Business Opportunity
The research data didn't just confirm a user problem — it pointed to a significant, underserved market. When asked what the single most important feature in a finance app would be, 72% of surveyed users stated "viewing everything in one place."
Most Valued Feature in a Finance App
Survey of 150 users, single choice
Viewing everything in one place
72%
Ease of use
57%
Automatic alerts
43%
Multi-bank integration
41%
The opportunity came with a condition: 54% cited "lack of security" and 46% cited "a confusing interface" as reasons they would not adopt a new tool. This set a clear, twofold business objective:
Build a platform that delivers the unified view users desperately want.
Do it with a simple, intuitive design and transparent security — or the adoption barrier cancels the opportunity out.
What holds adoption back
54%
Lack of security
46%
Confusing interface
Market Validation: Our Sample Wasn't an Outlier
To de-risk the business case further, the field findings were checked against secondary market data (Deloitte/EY, Visa, Capgemini — 2026):
75.2%
of Brazilians would like to consolidate multiple accounts in a single app — the average user maintains a relationship with 5 financial institutions (Visa, 2026)
46–49%
trust in AI-driven financial recommendations globally — nearly identical to the 50% found in our own survey (Deloitte/EY, 2026)
37.1%
of Brazilians who know Open Finance authorized data sharing despite 76.8% knowing the technology — the barrier is unclear benefit, not abstract fear (Capgemini, 2026)
Competitive context: active local players are Organizze, Mobills, and Minhas Economias (GuiaBolso was discontinued and folded into PicPay in 2026). App store reviews consistently cite unstable bank sync, duplicate entries, and incorrect bills — an opening for FinanceFlow to differentiate on data auditability (entry provenance, sync status, undo). The 2024 shutdown of Mint (Intuit) is a reminder of single-aggregator dependency risk — mitigated here by testing Pluggy and Belvo in parallel.
Who We're Designing For
Two personas emerged from the interviews: Davi (28, tech-savvy freelancer, wants automation but is skeptical of unexplained AI suggestions) and Sara (42, small-business owner, values reliability over feature-richness and needs to trust every automatic categorization she can't personally check). The tension between them — automate everything vs. keep control — shaped nearly every design decision below.
From Research to Design (Decision Map)
The Solution
The solution is a centralized, intuitive, forward-looking dashboard built on four pillars:
Main Dashboard
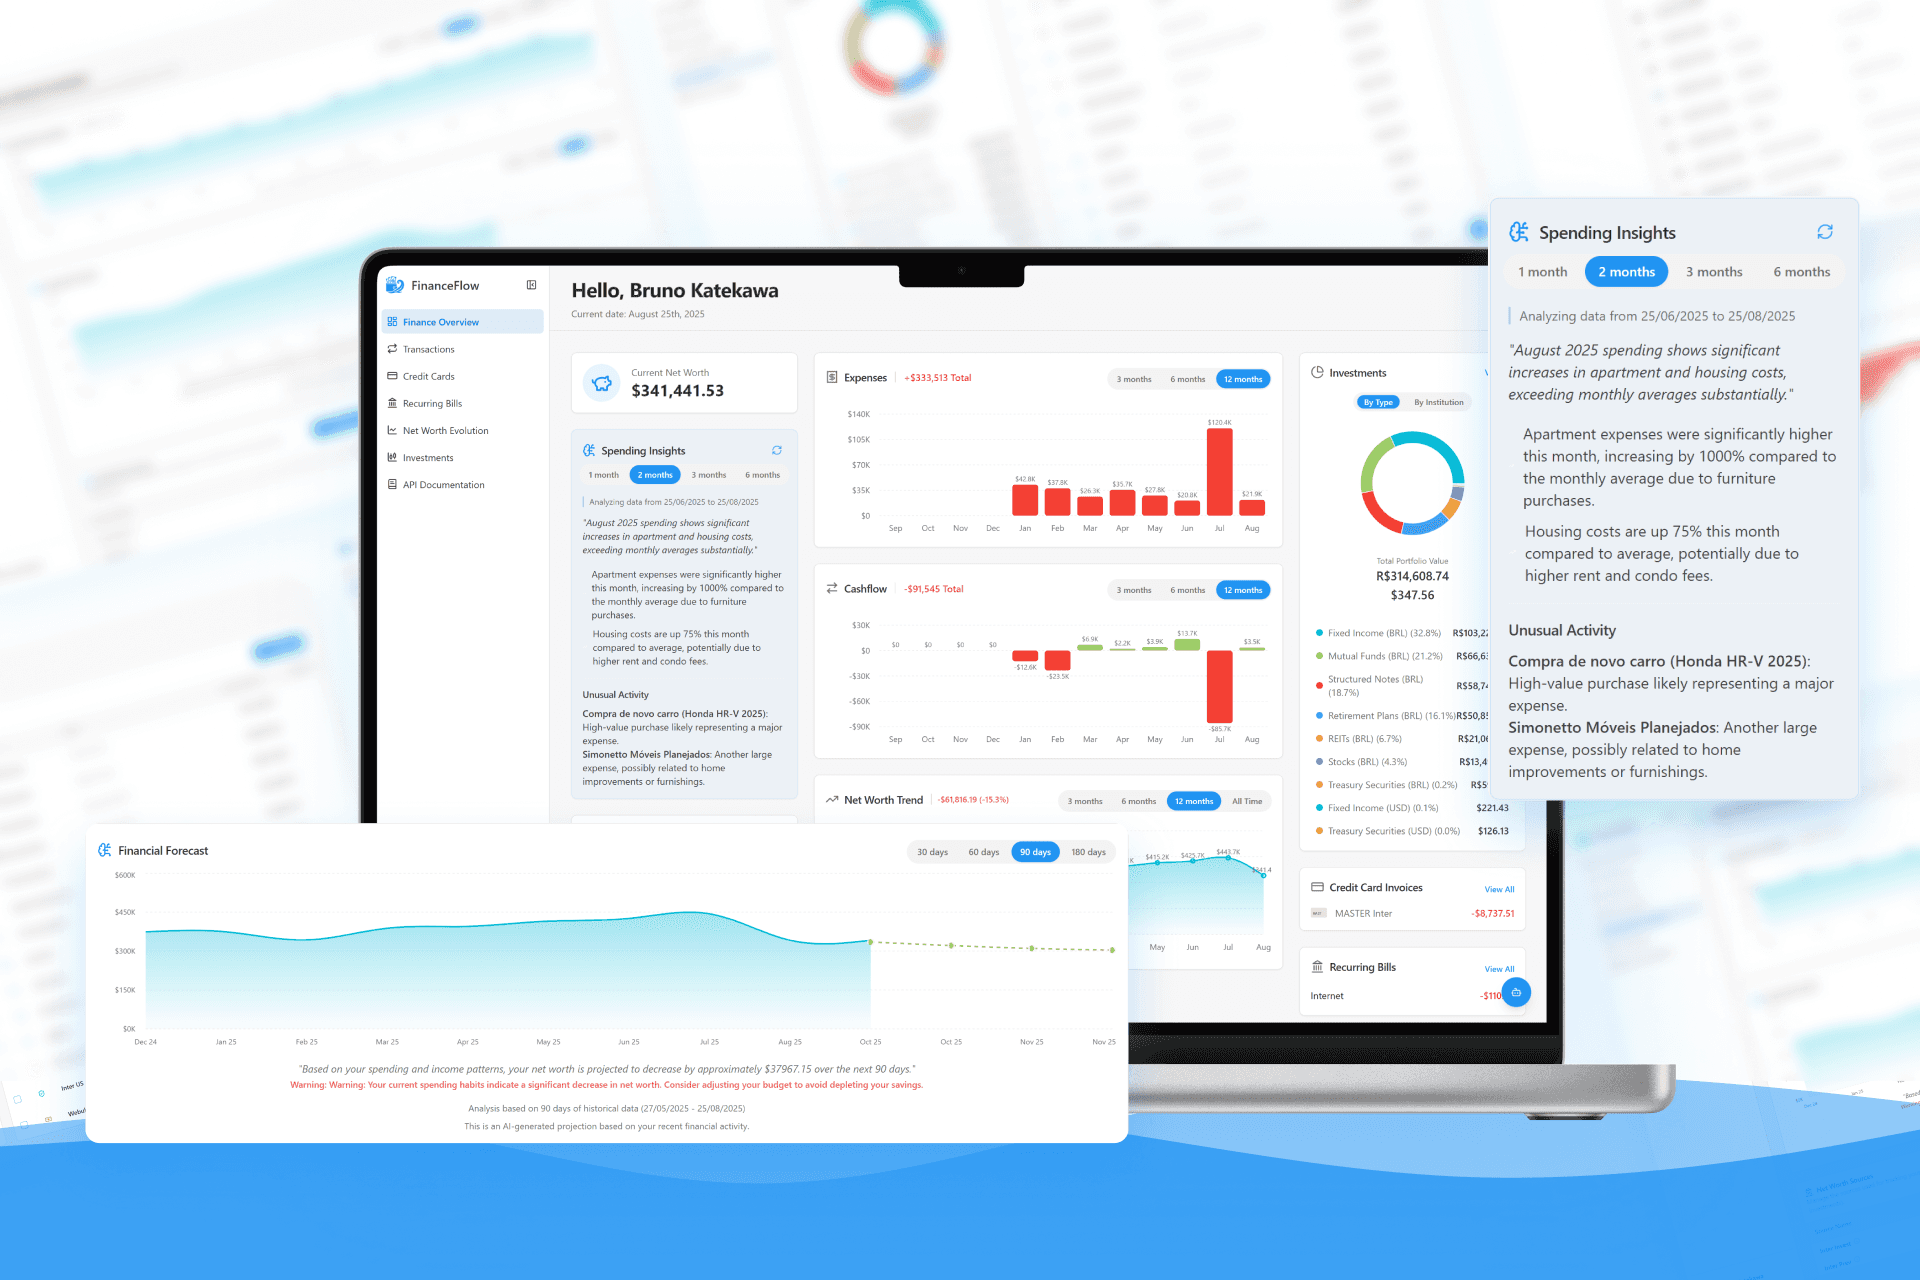
The financial command center: spending insights, cash flow, and investment performance in one view.

Transactions & Credit Cards
A searchable, categorized answer to "where did my money go?", addressing the 59% who felt they had no visibility.


Net Worth Evolution
Historical growth plus an AI-generated forecast, with support for custom asset sources (real estate, crypto).

AI Financial Q&A
Ask a direct question about your money in natural language, instead of hunting for the answer across pages.

Validation & Testing
Status: calibration pilot completed (projected personas) — a live round with real participants is planned next; see the integrity note below.
The core flows were tested with 10 projected personas (5 "Alex" + 5 "Maria" profiles) using think-aloud and the System Usability Scale (SUS).
SUS average: 46.5 (target ≥68) — Alex segment 53.5, Maria segment 39.5.
Key finding: 9 of 10 could not complete the CSV import — the one task meant to be plug-and-play (10% task success: Alex 20%, Maria 0%).
Severity-4 findings: ambiguity between two import paths (A), incompatible CSV format (B), and a unanimous absence of visible security signals (H).
What changed: the CSV import path and format were corrected, verifiable security signals were introduced, and dual-currency handling was clarified.
46.5
/ 100
Target 68
Alex segment
53.5
Maria segment
39.5
Calibration pilot · 10 projected personas (5 Alex + 5 Maria) · think-aloud + SUS
CRITICAL FINDING
10%
task success on the CSV import — the one task meant to be plug-and-play. 9 of 10 could not complete it.
Alex 20% · Maria 0%
Severity-4 findings: ambiguous import path (A) · incompatible CSV format (B) · no visible security signals (H)
Integrity note: this was a calibration pilot run with projected personas, not human participants. The highest-severity findings (A, B, H) directly informed design changes, but remain hypotheses to confirm in the planned round of 10 real user sessions. Outcome metrics (retention, engagement) remain a projected framework, never a measured result, until real usage data exists.
Measuring Success & Future Vision
As FinanceFlow is a conceptual project not yet launched for general availability, these are the KPIs I would track to validate the design and measure impact:
FEATURE ADOPTION
>70%
connect a bank account within week 1
TASK SUCCESS
>95%
categorizing a transaction
ENGAGEMENT
WAU/MAU
high ratio, tracked from week 1
RETENTION
MoM
benchmarked vs. fintech industry standard
Next steps: run the planned 10-session usability round with real participants, launch a small invite-only cohort, and iterate the roadmap from real usage data rather than the calibration pilot alone.
Key Takeaways and Lessons Learned
The final design successfully provides a holistic and empowering financial overview, directly addressing the fragmentation and lack of clarity our users faced. By consolidating all financial data into one place and providing actionable insights, FinanceFlow helps users move from feeling overwhelmed to feeling in control.
Throughout this project, I had several key learnings:
Clarity Over Complexity
In finance, it's easy to overwhelm users with data. My biggest challenge was balancing information density with a clean, intuitive interface. We learned that users valued a clear, high-level summary on the dashboard far more than seeing every single detail at once.
The Power of Proactive Insights
Simply displaying data isn't enough. Features like the AI-powered "Spending Insights" and the "Financial Forecast" were game-changers. Users don't just want to see their history; they want guidance on what might happen next and what they should pay attention to.
Design for Real-Life Scenarios
People's financial lives are messy. Allowing users to add custom sources like "Primary Residence" or manually adjust values was crucial. Acknowledging that not everything can be automated made the tool more flexible and trustworthy for users like Maria, who have complex financial situations.
Translate AI output into a user-centric experience
My primary lesson was that real value comes not from just detecting an anomaly, but from presenting that insight with context and clarity. Translating raw AI output into something meaningful requires designing with deep user empathy.
A successful AI feature is built on a strong data foundation
A key technical challenge was structuring data and prompts to ensure the AI's analysis was consistently accurate and relevant. This proved that a great AI user experience depends as much on thoughtful data engineering as it does on the interface design itself.
Embrace a holistic, end-to-end approach
Managing this project from the initial concept to the final AI integration reinforced how every decision, technical or strategic, directly impacts the user experience. This holistic view was essential for creating a cohesive and truly useful product.